ETH Technical Update — Testing Support After a Strong Run Off the June Lows
ETH has been climbing since Friday, June 26, moving from a low of $1,504 to a high of $1,945, and is currently trading around $1,825–$1,835. Price is now pulling back to test support at $1,776.
Structurally, ETH remains inside two overlapping channels: a broad macro descending channel and a smaller micro ascending channel within it. Price was recently rejected at the $1,927 resistance level. The next major resistance above is the $2,000 psychological level — if ETH reaches it, that's where CGH will be watching for a short, since it also lines up with the Golden Pocket (0.618–0.65 Fibonacci confluence, ~$2,071–$2,101) for that setup.
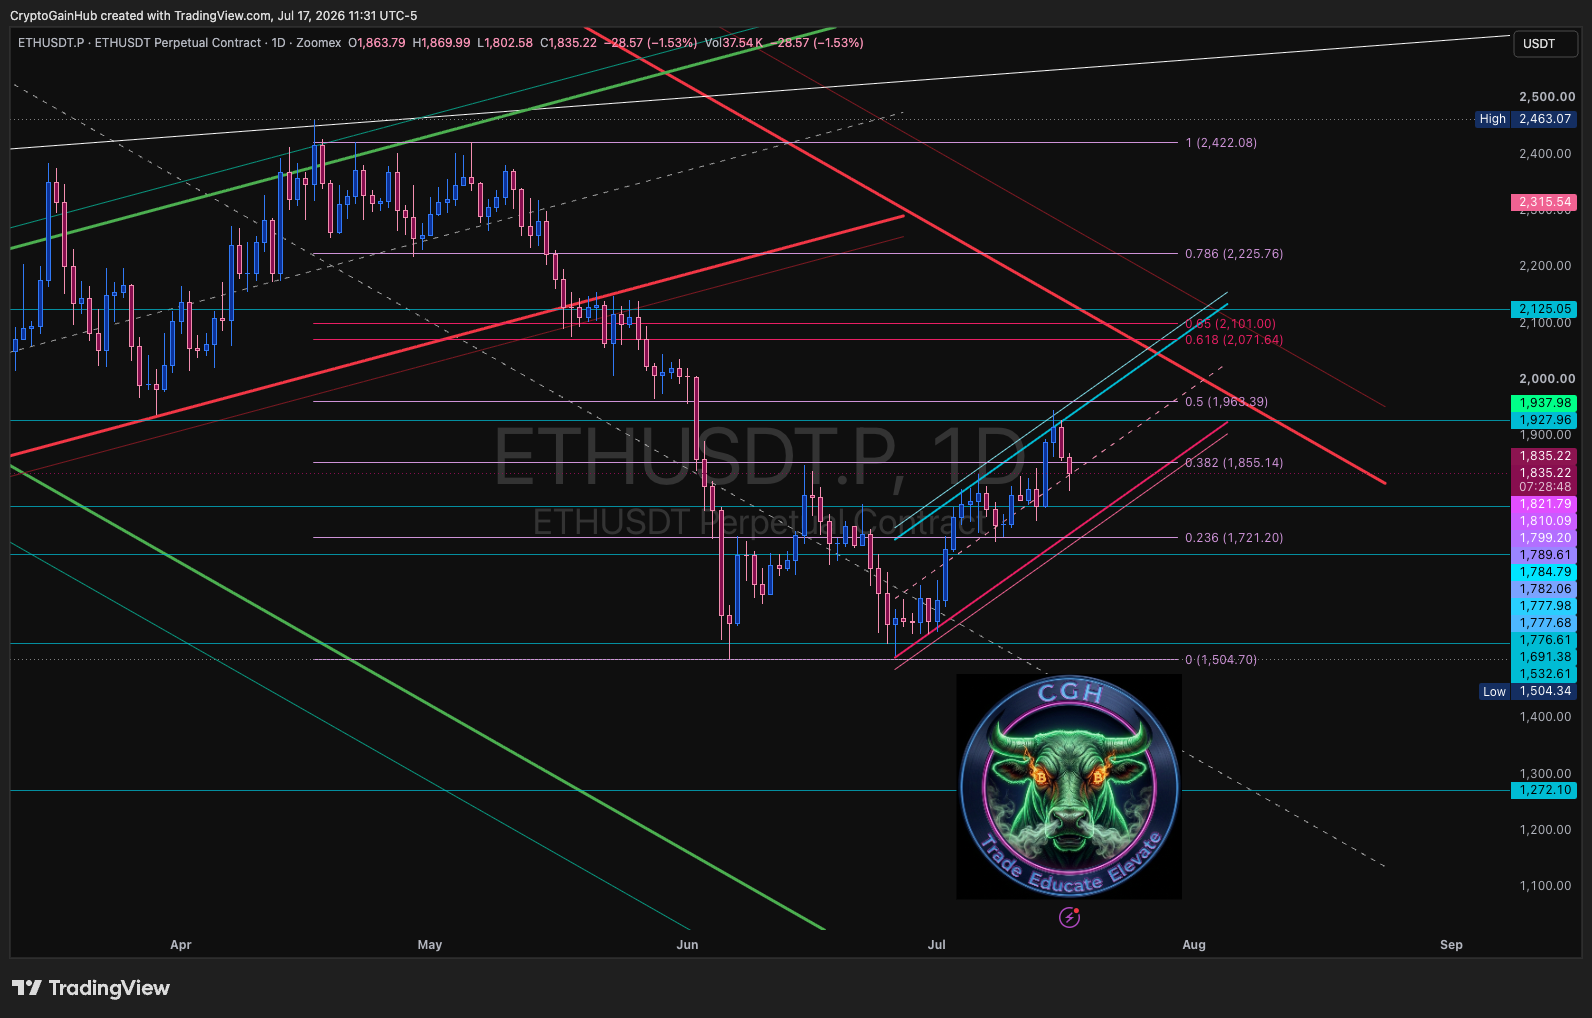
ETHUSDT.P · 1D — macro/micro channel view, resistance & short zone
On the macro Fibonacci retracement, the level to watch for a long is the 0.382 retracement at $1,776. If that doesn't hold, the ideal long setup shifts to the Golden Pocket at $1,674. Worth flagging: if ETH loses the 0.5 fib, that's a sign of weakness in the broader structure.
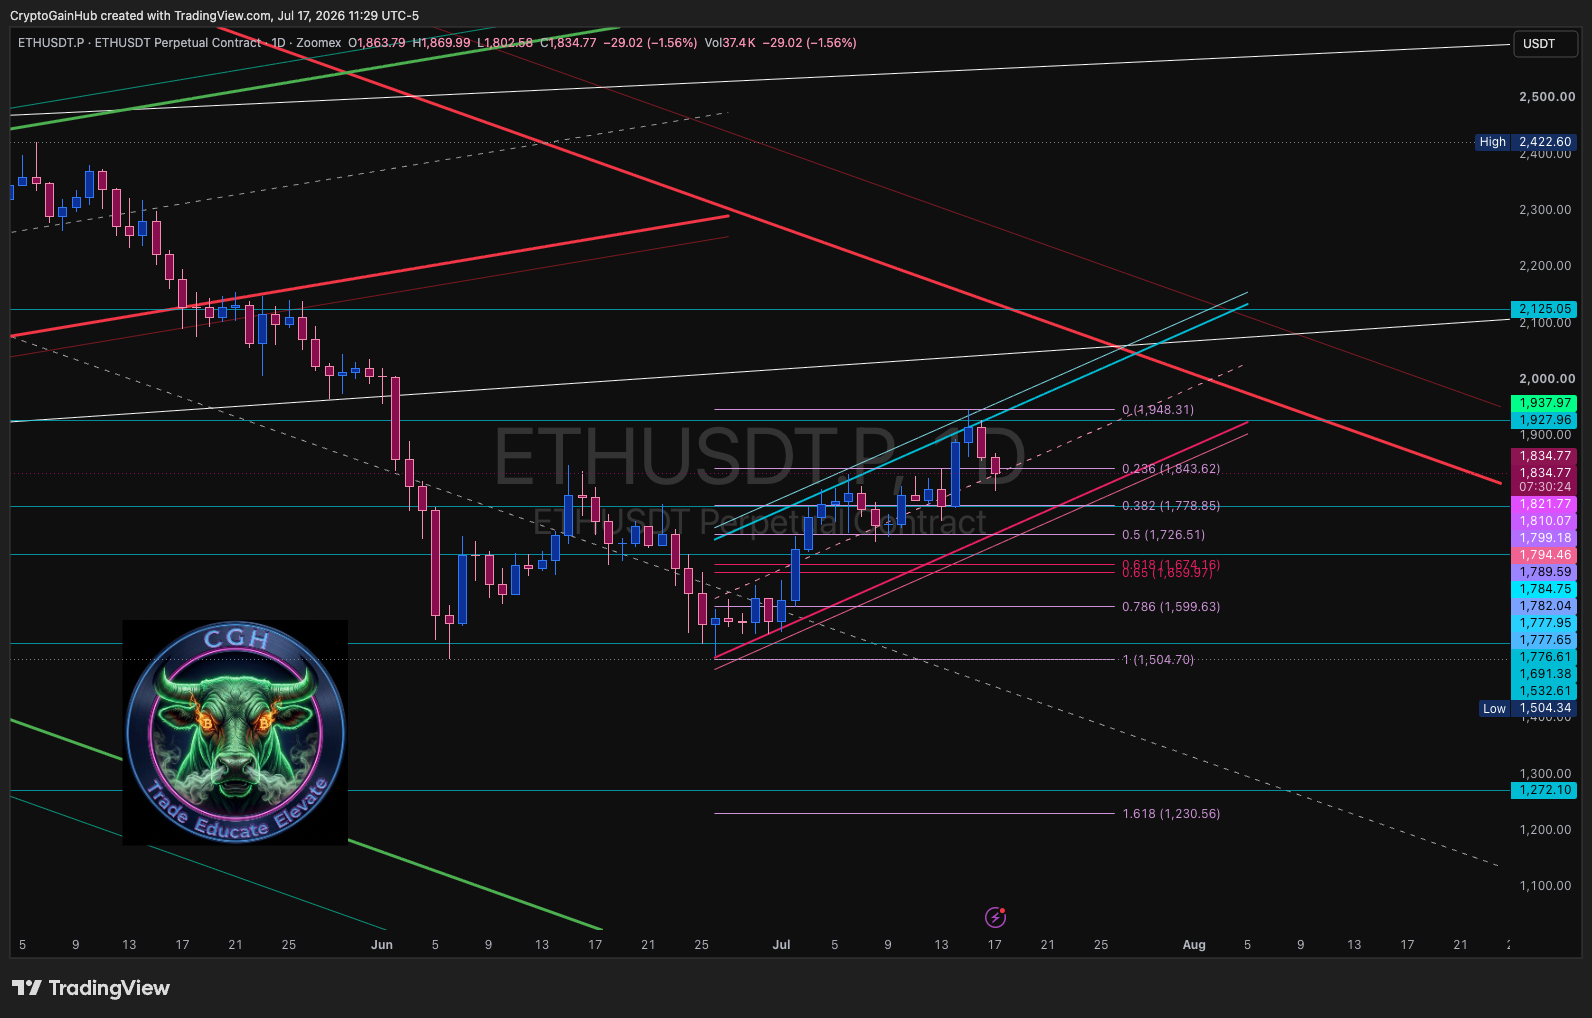
ETHUSDT.P · 1D — zoomed retracement, support & long zone
Why has ETH been outperforming lately? The ETH/BTC chart tells part of the story. ETH/BTC is in a large macro descending channel, but it recently broke a trend line after finding support at its own Golden Pocket, producing a strong move higher. Expect ETH/BTC to come back and retest that broken trend line as support. That relative strength against BTC has been a real factor behind ETH's move and recent performance.
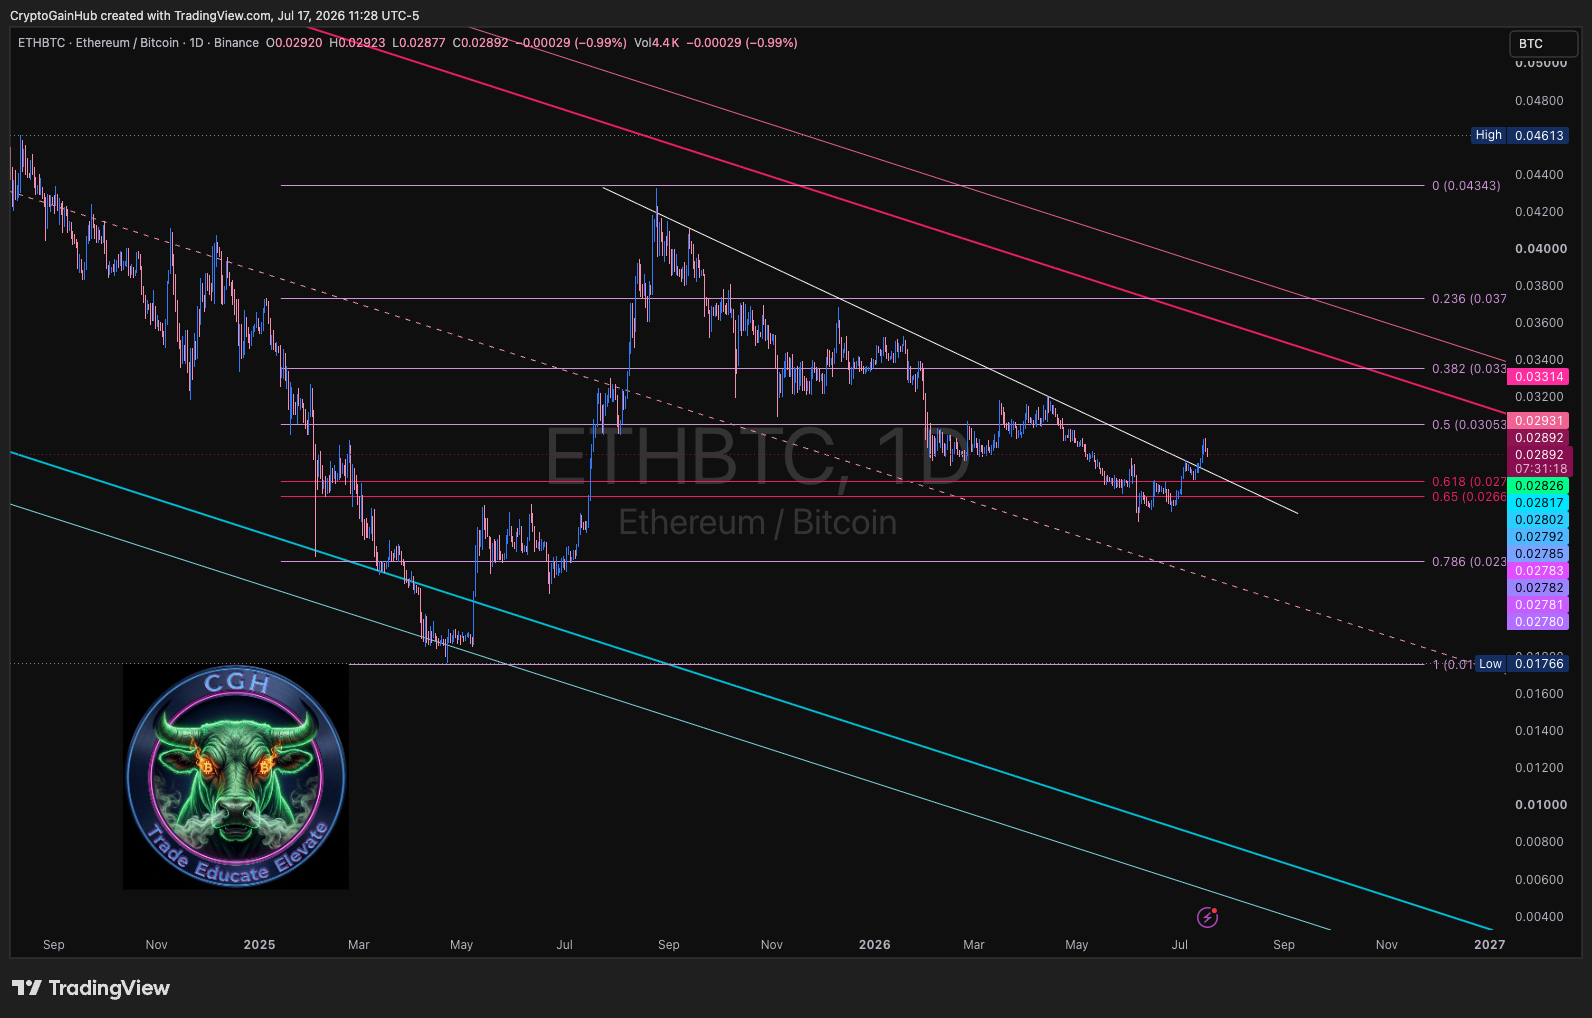
ETHBTC · 1D — descending channel, broken trend line & retest zone
— CGH
Not financial advice — always DYOR.